
Running for coach Frank Mooney on my way to a 1-mile high school PR of 4:21 at the Massachusetts Class D Outdoor Track & Field Championships.
Before every high school cross-country and track meet, my coach Frank Mooney gave each runner an index card with a goal time and suggested splits written on it. A goal time was meant to be challenging but within reach on a good day, and the suggested splits helped us stay on track through the start, middle, and end of the race to achieve it.
Mooney is still the immortal coach at Seekonk High School, but I’m not expecting to receive from him another index card before next month’s The North Face Endurance Challenge 50-Mile Championship. Instead, I’ll have to determine a realistic goal time and pace on my own.
An ideal comparison
This could be done with reasonably good accuracy if:
- I had recently finished this race;
- I had recently competed against other runners who had recently finished this race;
- I trained on the racecourse in California’s Marin Headlands, or could emulate the course locally by plotting training runs with comparable altitude, vertical change, running surfaces, and weather.
Unfortunately, none of those conditions exist. My performance at the 2010 race gives me a benchmark, but my fitness and training are different this time around. My ultra running history is very thin — and, since 2010, non-existent — so it’s difficult to reliably match my performances with those of other runners. And my training grounds in Boulder are notably different than Marin: elevations range from 5,400-8,550 feet, and the trails are generally steeper, rockier, narrower, and drier.
Controlling for variation
Imperfect as the effort may be, I tried anyway to determine a realistic race goal based on my training runs. I think I’m at least in the right ballpark. Here’s what I did:
1. I selected 11 recent training runs that I think are most representative of what I can do on race day, i.e. long duration, notable vertical change, and a sustainable pace. I did not include notably hard or easy runs, i.e. no threshold work or recovery runs. Then I compiled the data gathered during these training runs by my Suunto Ambit2 S GPS Watch.

2. I calculated the vertical change per mile for each run, which is an indication of the route’s inherent difficulty. This gave me a second variable to compare the runs against one another, along with average pace.
3. I controlled for the effect of altitude on each run’s average pace, versus what a comparable effort would achieve at sea level. In the Marin Headlands, studies on endurance athletes suggest that I can expect about a 5 percent performance improvement.
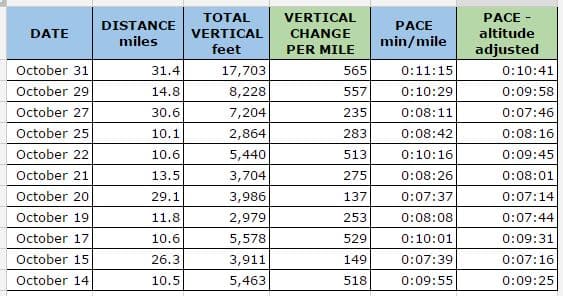
4. Finally, I plotted the relationship of Vertical Change per Mile and Altitude-Adjusted Pace of each training run. The trendline is remarkably good, i.e. my average pace on the training run was predictably faster or slower depending on the amount of climbing and descending.

For those unfamiliar with the dramatic effect of vertical gain/loss on pace, you may be surprised that I did not rely on a chart of pace versus distance, thinking that I will naturally slow down with longer and longer efforts. For curiosity, I did plot this relationship and found that there really isn’t one, because vertical gain/loss is so much of a larger influence on pace than the distance of a training run.

So what does that mean for the race?
As the above chart shows, my average pace is very strongly and very consistently affected by the vertical change per mile of the training route. This relationship is actually much stronger than the relationship between average pace and distance.
For example, my altitude-adjusted average pace on October 20 was 7:37 for 29.1 miles, whereas three days earlier my pace was 10:01 for 10.6 miles. What explains the 2.5-minute difference per mile? Because the run on October 17 had nearly 400 more vertical feet of climbing or descending per mile. In comparison, I was only 1:10 per mile slower on October 31 versus October 17, when my route had comparable vertical change (actually, a little bit more — 565 versus 529) and was 20.8 miles further!
If I know the vertical change per mile of racecourse, then, I can predict my average pace and then calculate a finish time. According to the course guide, the course is 49.7 miles long, has 9,237 feet of climbing and 10,043 feet of of descending, or 388 vertical feet per mile. Rob Krar, who won last year’s race, reports slightly different data on Strava, but I’ll stick with the official numbers.
Assuming that the relationship holds on race day between the course’s vertical change and my average pace, I can expect an average pace of 8:52 per mile, which results in a 7:20 finish time. Here is the chart with the race projected added, right on the trendline:

Of course there are reasons to think that this relationship may or may not remain true on race day. For example, I’ll benefit from race-day excitement, the company of other runners, and fresh legs after a two-week taper. However, I could also fall badly off the pace between Miles 31-50, which are distances I have not ventured into during my training. And I could also have some unexpected challenges on race day: falling, botching my nutrition, suffering from travel-related sluggishness, etc.
I guess we will find out on December 6!
Excellent. I love this stuff 🙂 I’ve been playing around with creating a single number to measure performance (call it “E” for efficiency). I’m using E= pace*hr, so a number that gets smaller as I improve. This works nicely as I’m using the same route most days, but also multiplying E by elevation gain might normalize for different routes. I *know* my pace plummets at longer distances, so I’m now monitoring E as a function of distance (or a workout). My goal is to make it as constant as possible.
E is something you can measure throughout a training cycle to measure improvement and spot training plateaus…
Keep up the number crunching and good luck with your race!
For those who run mostly on flat terrain, there would be a much stronger relationship between pace and distance, with a likely drop-off in pace as distance increased. (When I graphed this relationship with my data, the points were all over the pace, due to the very strong effect on pace by the introduction of vertical change.) It definitely would be possible to monitor fitness based on this drop-off — the fitter and stronger you are, the less drop-off there will be.
Classic Skurka analysis! I love it. Wish I had another 50 on the schedule but with 4-5 deg temps this week I’m also glad I’m not having to get out on 20-30 mile runs now.
Will be very interested to see how your hypothesized results turn out on race day. Lower elevations for me help more on distance than on the speed, what seems like a push pace at 7-8,000 feet is a comfortable, feels like I can run all day, pace when I run at near sea level. Naturally that means I can run faster for longer at lower elevations; but on an ultra, at least for me, the key has been keeping a sustainable pace going throughout and not over doing things in the first half. Anyway, thinking the elevation should help you in your 30-50 mile sections that go beyond your training runs vs the altitudes you are at around Boulder.
Enjoy, good luck and look forward to the race report.
Came across this 6 years later; looked up the results and Andrew finished in 7:26:05 so this was pretty damn spot on!!